

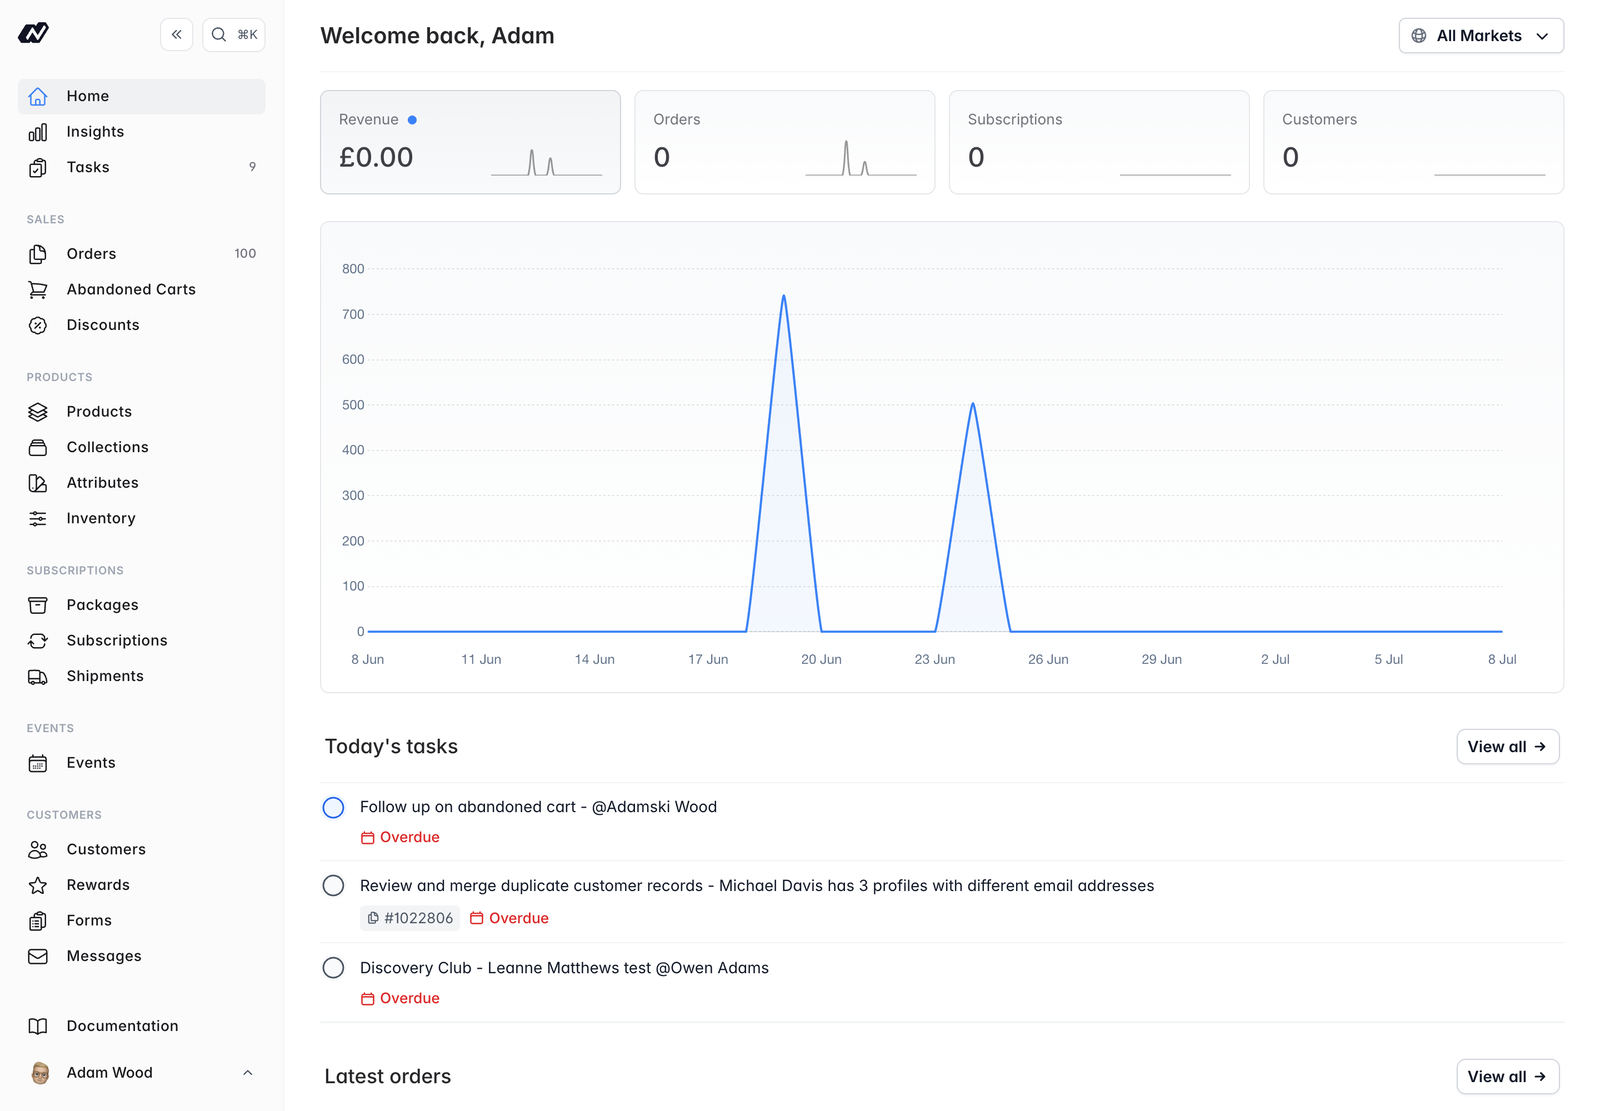
Test-mode data is excluded from all dashboard stats, so the figures you see reflect real trading only. See Test mode for more.
Welcome header
A personalised welcome header greets you at the top of the page, so you always know whose store you’re looking at.Setup checklist
New stores see a Setup checklist that walks owners and admins through the key steps to get up and running, such as disabling test mode and going live. Work through the steps at your own pace, then dismiss the checklist once you’re done. It won’t come back once dismissed.Performance stats and chart
The performance section shows your headline numbers, revenue, orders and subscriptions, alongside a chart of the same figures over time.- Choose a date range to control the period the stats and chart cover.
- If you sell across more than one market, use the market selector to focus on a single market or view them all together. Your choice is remembered for next time.
Revenue protection
Two tiles surface money that’s at risk so you can act on it quickly:- Failed payments - jumps straight to the affected orders so you can chase or retry payment.
- Pending cancellations - shows subscriptions that are due to cancel, so you can reach out before they lapse.
Today’s tasks
The Today’s tasks section lists tasks that are due or overdue, so nothing slips through the cracks. See Tasks for more on creating and managing them.Latest orders and subscriptions
Two tables round out the dashboard:- Latest orders - your most recent orders, with a link through to the full order details.
- Latest subscriptions - your most recently created subscriptions.